


 |
|
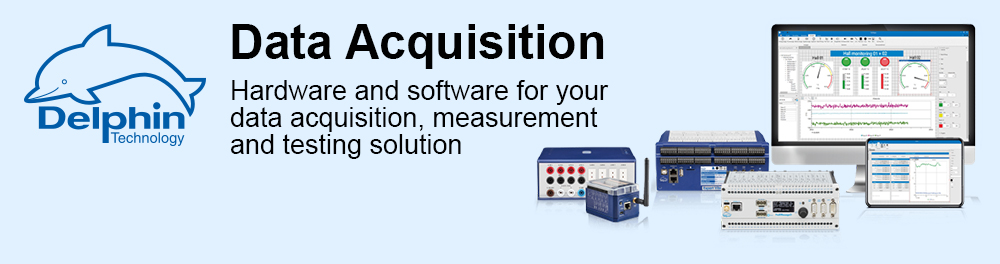
Data acquisition and saving
|
|
With ProfiSignal 20 Go you can start collecting and analysing your measurement data without long lead times. |
|
Fast project planning and analysis of measurement data with ProfiSignal 20 Go
|
 |
|
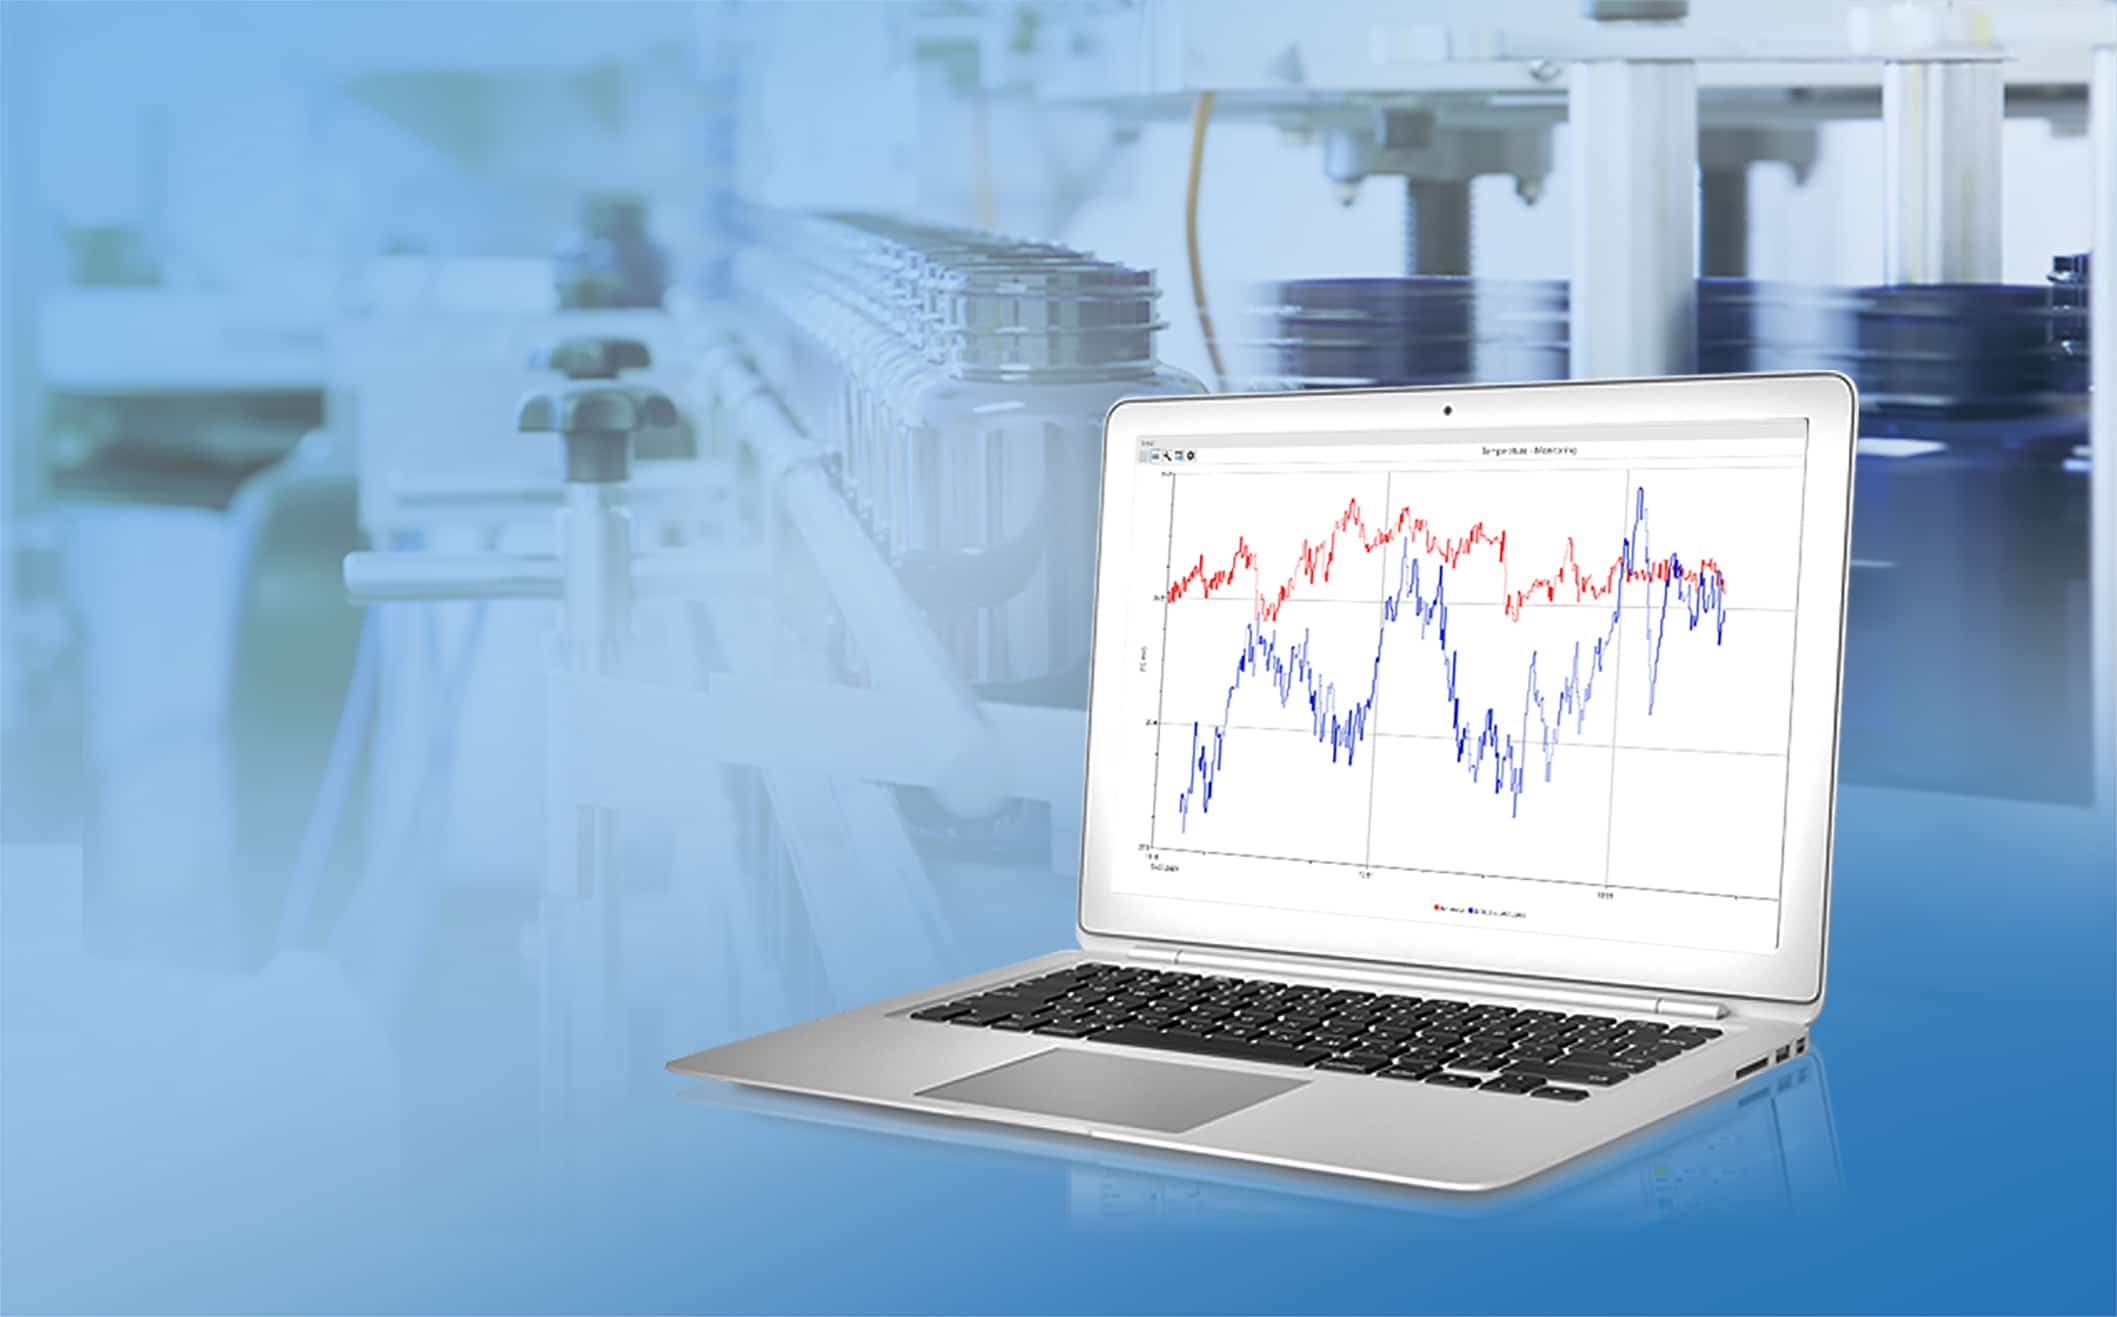
With ProfiSignal 20 Go you can visualise your measurement data in just a few steps, both online and offline, in various diagram types, monitor, analyse, archive as a measurement file or export directly in the appropriate file format. Already during the ongoing measurement, you can also access historical measured values without interruption, for example, to compare them with the current test. With the help of various statistics functions, data areas to be examined can be marked and analysed directly. |
|
Product highlights
|
|
|
Optimised data handling
|
 |
|
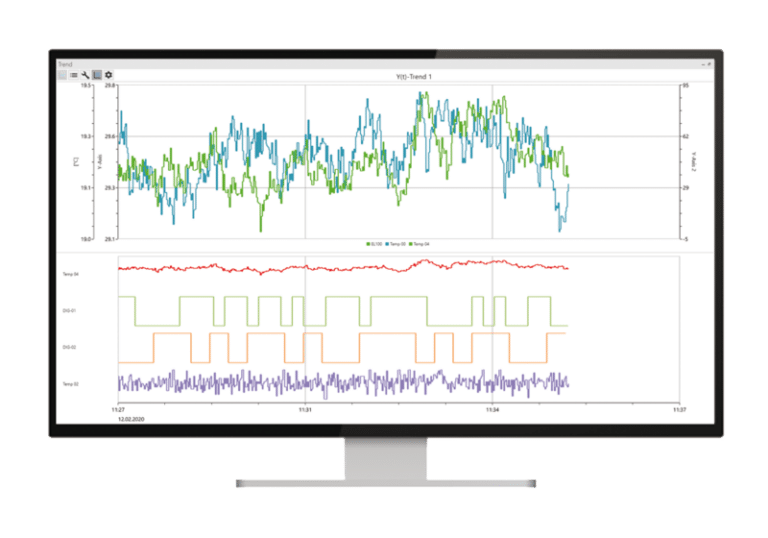
The recorder function simplifies test execution, enables direct comparison between different test runs and is required for batch processes. The recorder function generates a measurement data file, which can also be easily sent by e-mail for further evaluation. With the multi-track diagram, you can link several measurement curves with the same time axis, e.g. for direct comparison of analog and digital signals. Withe the SCACH function, you can connect directly to your machine with your smartphone or tablet via WLAN and start the data visualization, simply by scanning the QR code attached to the machine. Unnecessary detours for the measurement data are thus avoided and failure and safety risks are minimized. |
|
Functions
|
|